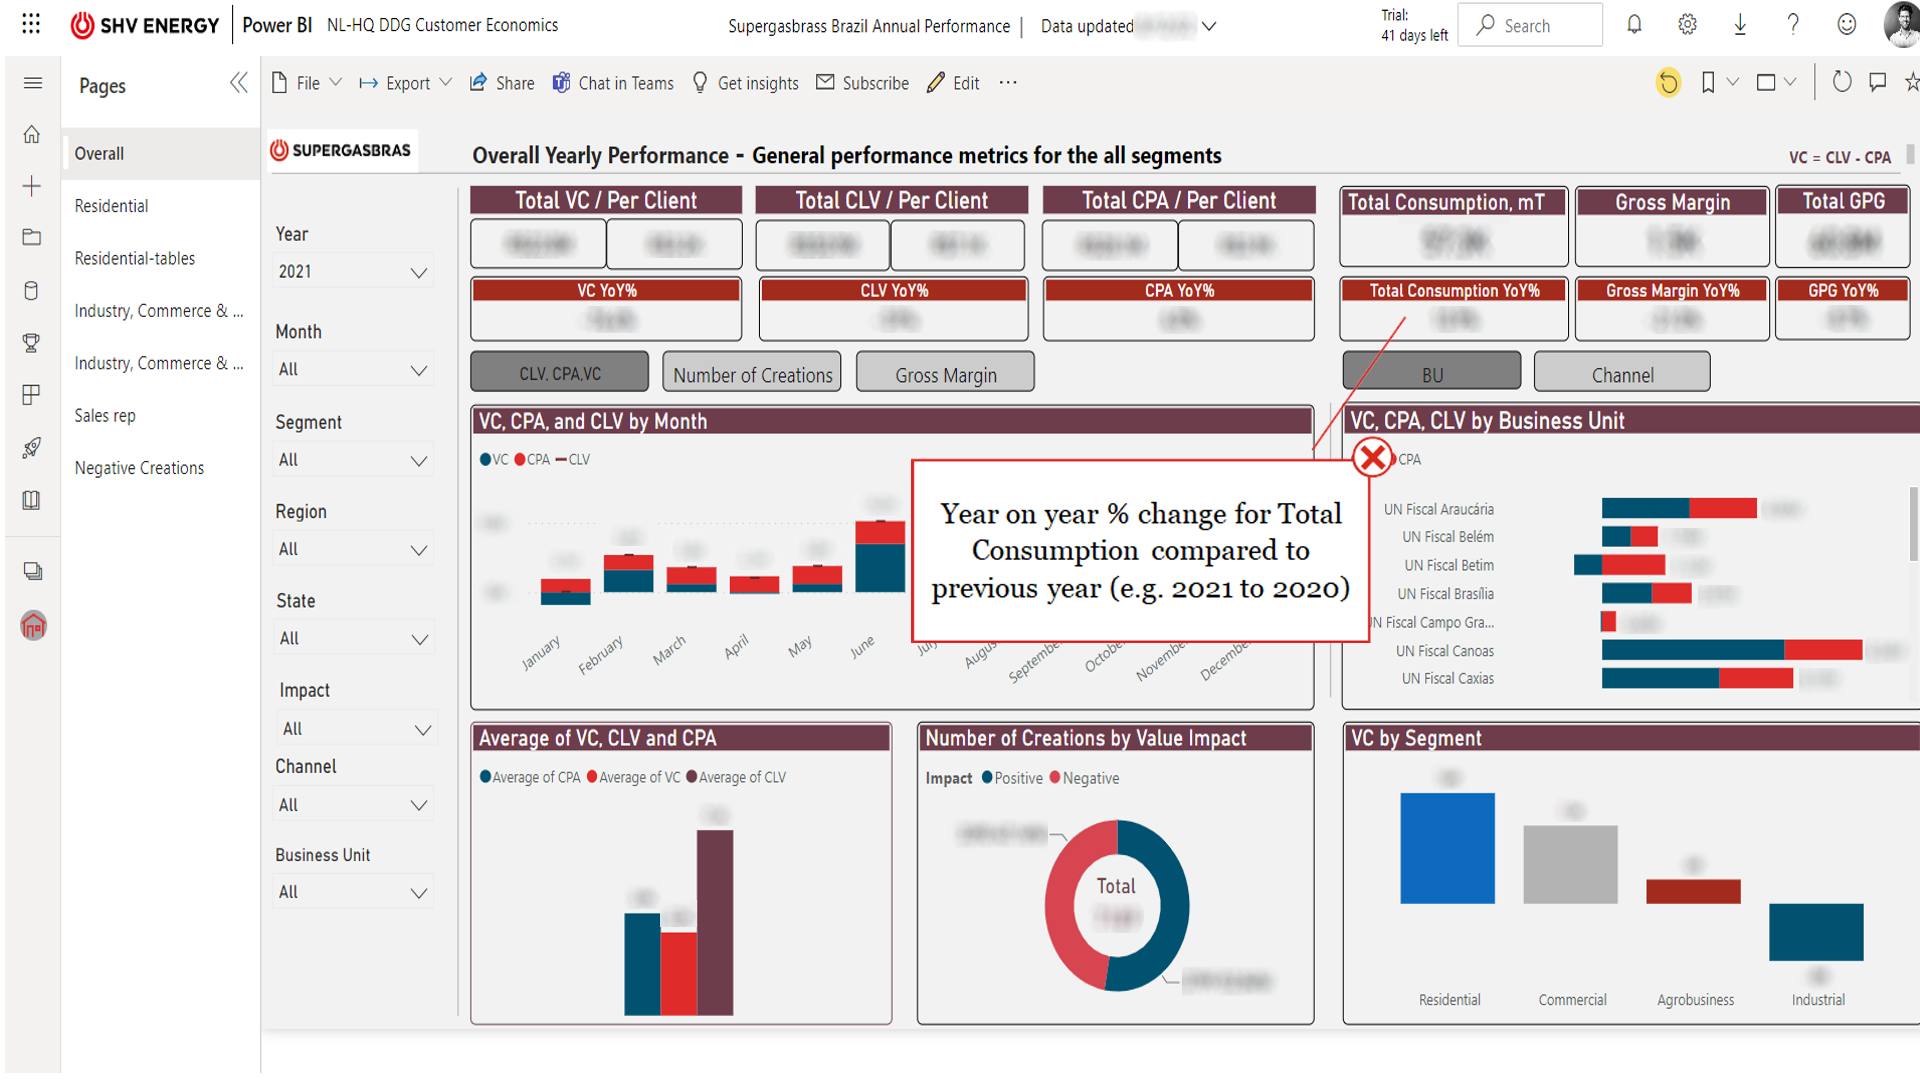
Clickable powerpoint
The Brazilian branch of SHV Energy recently implemented a sales dashboard that improves the analysis of sales pipelines and statuses. To support the adoption of this new dashboard, we were asked to develop a clickable Powerpoint document that serves as a quick reference guide. The purpose was to have an easy and quick way to lookup the definitions and formulas of the several KPIs in the dashboard.
We were happy to assist SHV Energy with this quick solution that made a big difference in the change management process of the dashboard.

